
 Life certainly has its ups and downs! I know I have experienced my share of them! Everyone I have ever talked to agrees that no one is immune to life’s challenges. Everyone has his or her ups and downs despite the level of perfection that the media would like us to be exists in the lives of the world’s famous figures.
Variation Has its Ups & Downs!
Let’s talk about one of the fundamental principles of improvement for a few minutes. It’s the concept of variation. Variation is just what it sounds like. It’s when performance changes from point to point, sometimes up, and sometimes down.
Many of us grew up with the idea that perfection was not only the ultimate goal, but also the expectation. Grades were scrutinized, behavior was modified, and rewards or punishment given according to what we had achieved. How many times did you hear the warning; “Your grades are starting to slip, you better get with it!” I know I heard it a ton! Of course my grades had a tendency to go up or down quite a bit……
Later in life, actually a lot later in life, I was exposed to the idea that there is some amount natural variation inherent in every part of our existence. This revelation from my teachers felt like someone had opened the door and let in a cool breeze on a hot day! It made me feel so good! I suddenly realized that I was not the failure that I had always thought I was when I didn’t get the types of grades my sister did, or achieve the tremendous things my brother did. I was ok! Yes I had my ups and downs over the years, but now I could look and see that my consistency or low variation was a good thing.
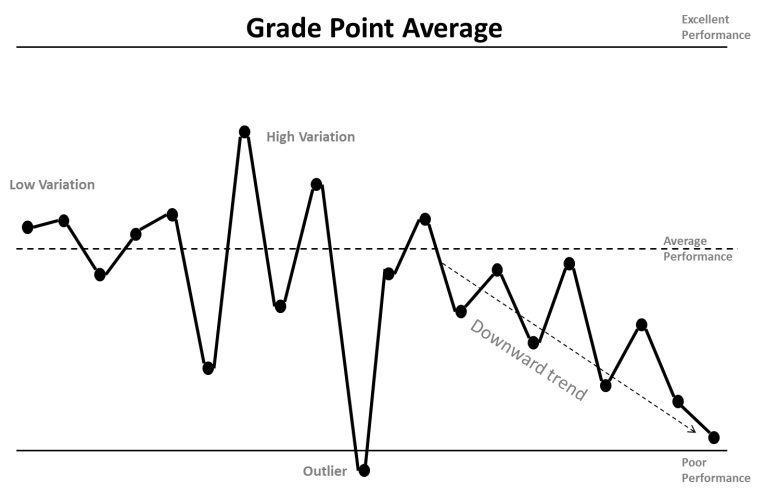
Some statistical speak might help you understand what I am trying to get across. If you look at the chart above, you will see that there are points, connected by lines. These are arranged in sequential order. In this instance, the chart tracks performance over time. Thus, each dot is a representation of performance at some period of time. (Pun intended!) For our discussion it really doesn’t matter what kind of performance they represent, but just for kicks, let’s stick with our discussion of my grades. I’m used to talking about that one! You’ll notice that there are also three horizontal lines represented on the graph. The dotted line in the middle is what the statisticians call the mean. I honestly don’t know why they call it that, other than they were being ….. But that line is the expected average performance of whatever group that I was being measured in. The two solid lines could be called the upper and lower expectations that apply to my grade performance. Obviously poor performance is a bad thing, and excellent grade performance would be a wonderful occurrence, though the probability of that ever happening would be hard to swallow!
A Normal Guy
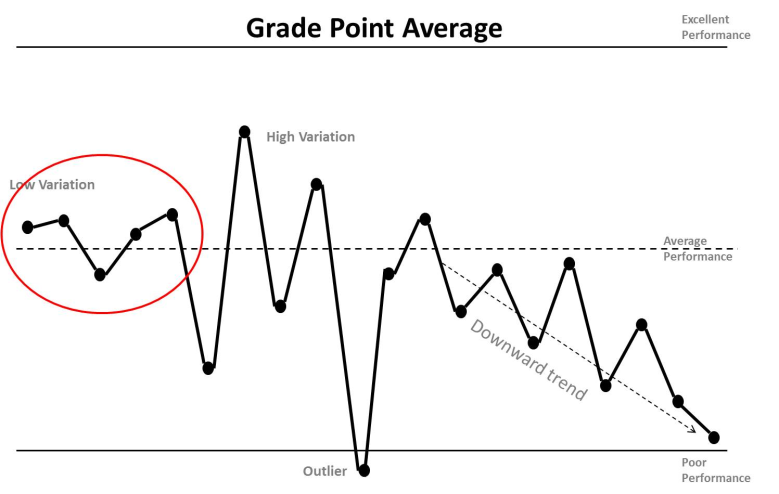 Let’s talk about variation. You see the first 4 points to that I have circled? Those points represent a fairly low amount of variation. The distance from each point to the average is not very great. We could say that they range pretty much around the average. Now, let’s assume that each of those points represents my grade point average for the last several grading periods of my High School years. And yes I was pretty much your average High School student, not the best grades, but certainly not the worst either. But you must admit, I was pretty darn consistent!
Wow! What’s happening?
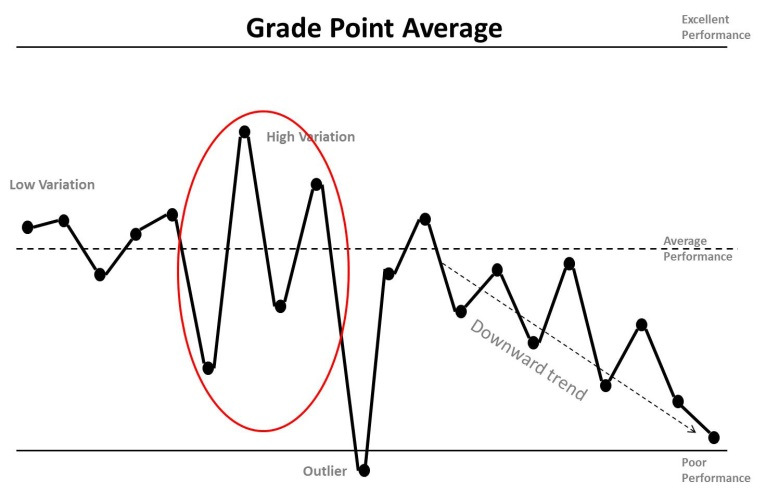 But wait a minute, the next several points seem to get a lot more erratic. The amount of variation goes way up. They kind of remind me of a teeter totter! Up and done, up and down. I think you will agree with me that something must have changed! And indeed it did. When I went to college, I was in for a rude awakening. I was suddenly plunged into an environment where the measure of my performance, my grade point average, directly reflected the amount of focus and effort that I put into my school work. And as you can see from the wide variety of ups and downs focus and effort were not my strong suit.
But wait, there were a couple of data points in there that are significantly higher than the rest. These were high points in which the combination of classes that I was greatly interested in, as well as some extra motivation on my part resulted in better than average performance, and you might say exceptional performance for me at that point in my life. So a large amount of variation can include highs in performance as well as lows. Basically it just means that there was, well, a large amount of variation in my performance at that time!
You’re Out of Bounds!
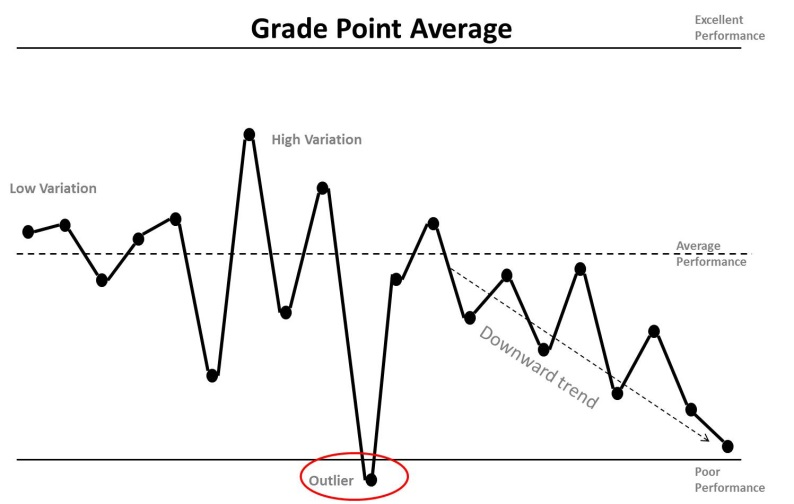 You might be wondering about that point way down there below even the Poor Performance level. That point is what we call an outlier. An outlier is a data point that is not consistent with the other observations. It usually indicates that something out of the ordinary has taken place or maybe you’ve made a measurement error. (You’re might not be as bad as you thought….)
Well, that particular grade point average happens to be one quarter that I (the art major turned business major) made the mistake of taking a college calculus class. Can you say, “It was all Greek to me?” Needless to say, that quarter was a chore for me! Even with all of that conscientious effort I made, I did not pass that course! Years later though, I retook that class with my algebra book in one hand and my trig book in the other, and barely squeaked by. I honestly think the professor took pity on me and gave me enough points to get by. But hey, I passed the class!
It’s All Downhill From Here!
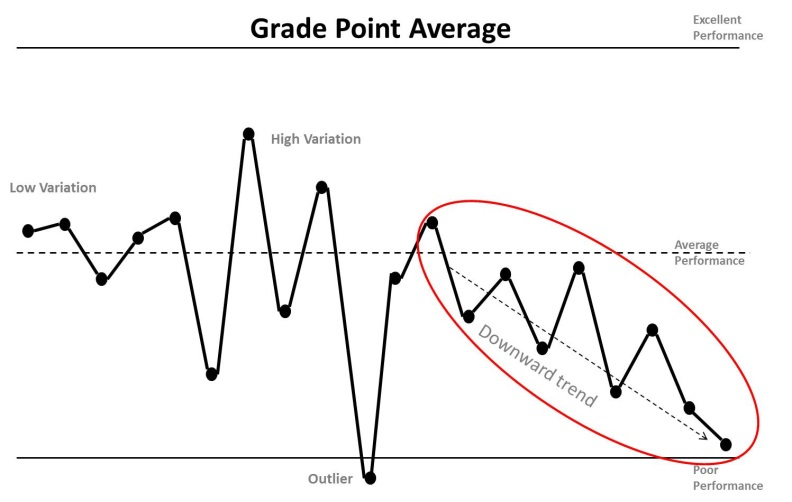 About those ending grade points that drive downward like the balance in my checking account at Christmas time. I needed to show you a downward trend so I made those last few grade points up. No one said I had to be truthful about my grades! Those points represent a crucial idea. Sometime things in life happen that send us in a tail spin. Progress is lost, and from the short term view a crash and burn is certain to happen at any time….. But there can also be the wonderful experience of seeing an upward trend as well. That could indicate a period of progressive growth.
Actually, I ended up terminating my college career a couple of years after I joined the LDS church and served a full time mission. After my mission, life happened. I got married, we started having kids, I apprenticed and became a Tool & Die Maker. And talking about variation, if we could only chart those years! What ups and downs, and trends you would see! But eventually I did end up finishing my Bachelors degree in Business Management as a nontraditional student, and those As & high B grades were hard earned! Both on my part as well as my wonderful family.
What Are You Trying to Say?
So why have I taken all of this time and space to lay bare my educational life in terms of a chart showing grade point averages over time? What lesson or point might I be trying to make here? Please take a few moments, push the pause button, oh yeah this is a book…., and look at the chart, then think about what I have told you about my grades, and my life. What direct applications or parallels come to mind? Let’s see if we have some of the same thoughts.
Looking at variation helps us see changes.
Isn’t it amazing that a person can look at a simple visual representation of something as seemingly obscure as a chart of average grade point averages and see that there might have been challenges in my life? There seemed to be periods of my academic career where I was quite the average student , what some students of statistics might call normal, then there were times when I had periods where something else was going on that caused me to have much greater variation in my performance. If you were sitting in counsel with me, you might well ask what was going on in my life that caused that much variation in performance at that particular time. Was there some special cause that stole away my consistency and caused me to shift from small variation to large variation. Tracking and analyzing variation over time can help us see and address issues in our lives.
There will always be some variation.
I like the concept that there will always be some amount of natural, or common cause variation in everything, every process, and especially in our behavior. Let’s face it, life is messy. Sometimes I have a better attitude than at other times. I am more motivated in some periods of my life than at others. Rather than obsessing on the fact that I am not as consistent as I think I should be, or as consistent as I think my neighbor is, I can look at my amount of variation in relation to what I call control limits. Those are the boundaries beyond which I should not go if I want to stay safe and expect positive outcomes in my life. An example of what I mean. Looking at the graph at the second set of grade points, the series that showed an increase in variation, even though it was more erratic, the points were still well within tolerances. I was not as consistent, but I was still progressing, I was learning, and life was still good.
Don’t beat yourself up.
Just move forward. This is the powerful lesson for me. Even if you think you are not as consistent as you should be. Figure out what is causing the variation, identify what you can control or change, make a plan, and work that plan. A caution, don’t try to change or fix everything at once. One step at a time has a better chance at success. I’ll share an example.
The Test
 Let’s say that I have determined that I am very inconsistent in my gospel study. If I envisioned my time spent each day over a month I might find that sometimes I managed to spend a considerable amount of time on consecutive days immersed in the scriptures or gospel reading, but other times I managed only a few minutes, or perhaps not at all. If I focused on the amount of variation I saw, I might wrongly conclude that I just didn’t care enough about spiritual things, or that I am simply not disciplined enough.
But, I have been a continuous improvement coach long enough to know that going with the first possible cause that we find or think of is usually not a good thing. There are probably several factors having an effect on my gospel study. Brainstorming what those variables might be will be the next logical step. A variable (such as x or y) is that part of an equation that can change in value. So what are some variables in my life that might change that could be effecting the amount of gospel study that I do?
 Let’s just say that I have decided that the three most probable and potent variables are:
- The hour at which I have to be at work. (Being a Bishop, morning hours are my only totally discretionary time.)
- How late I got to bed the night before. (The earlier I get to bed, the earlier I am able to get up.)
- How much time I dedicate to my morning exercise routine. (Yes I do morning work outs, looking at me you might not think so!)
 Those are the three variables that I think affect the amount of variation I have in my gospel study time. If I really wanted to be scientific about this, I could start tracking each of these three variables as well as the amount of study time each day for long enough to see if there is a correlation.
I’m thinking a chart taped to my mirror that I have to look at and update each day before I go to bed. Sounds fun doesn’t it! After a couple or three of weeks doing that I would have enough data to run an analysis in a statistical package that would tell me for sure. I am a great fan of tracking. I believe that we don’t improve what we don’t track. Not my original idea, but great nevertheless. Seeing patterns and especially improvement is important to getting better. I can honestly say that I have tracked all sorts of variables in my life. Time spent doing a variety of activities, spending, food consumed, and one time even the amount of sleep I got. OK, so sometimes I can be a bit obsessive… you think? But honestly, if you want to get a good handle on how much you are or need to do a particular activity, or habit, try tracking it for a while. You will be amazed at the insights you will gain.
The Old Fashioned Way
 Or I could do it the old fashioned way and start adjusting and controlling the variables, changing the times I allocate to each until I get the amount of consistency I want in my gospel study. The bottom line here is, I am more interested in the end result than on doing the scientific experiment. I think I’ll just play with the variables until I get what I want……
Looking at the variable I listed, I don’t have a lot of control over what time I have to go to work in the morning. It totally depends on what early morning calls I have, and what teams or training I am involved with. So that variable may just be the one that drives the others. You will probably find that there are one or two variables in your area of improvement effort that will be dominant. Then there are other variables that respond to the dominant ones.
For example, if I have to be at work at 6:30 am for a coaching call,(darn those different time zones!), I may need to make sure I get to bed at 9pm so I can get up a bit earlier. In this case, the time I have to be at work is the dominant variable, and the time I need to get up, and the resulting time I need to get to bed are the responsive variables. A side note…. My boss might just say that the time to be at work is not really a variable at all, it is a constant which I cannot change. But that’s a discussion for another time. Going back to the three variables I identified as critical to my success, given the time I have to be at work, I might also have to limit myself to a half hour of exercise rather than a full hour.
The Plan
Here’s the plan that I will put in place to make sure I achieve my goal; to get adequate exercise, given the constraints of my morning routine. My plan is in place. When I have to be at work early I will get to bed at 9pm and set my alarm for 4:30am. The next morning I will exercise one half hour and shower. Then I will study for one half hour so that I can beat it to work to arrive just before my 6:30am call. Another day I might not have to be to work until 8am. The plan for that day might be going to bed at 10pm the night before, getting up 5:30am, working out for an hour, quick shower, one half hour of study, and off to work to arrive at 8am. Some variables changed, but the one I wanted more consistency in, gospel study, did not. So my focus on changing the variables to achieve the output I truly want has become an experiment. When I conduct a personal experiment like this, I try the routine for some period of time mentally tracking the results, and decide whether the benefits are worth the effort. I also note whether I truly do have enough control over some of those variable to allow the adjustments I need. For example my early bed time….. sometimes it is just not happening! Late meetings or unexpected emergencies do come up, and my options there will probably boil down to deciding which I want worse, at least seven hours of sleep, or to make sure I stay consistent with my gospel study.
Wrap It Up
Summing up (please excuse the statistical joke) the basic method I use to work towards incremental growth is:
- Look for variability in my behaviors that is preventing me from achieving what I desire.
- Express my specific goal or target, what I want to achieve.
- Identify the variables that contribute to the variability of my behavior.
- Develop a plan to control those variables. (design the experiment)
- Try the experiment, review the outcome, and adjust.
Alma, one of my favorite ancient prophets, gave an excellent lesson on the subject of conducting experiments as he taught the Zoramites how to develop faith.
27 But behold, if ye will awake and arouse your faculties, even to an experiment upon my words, and exercise a particle of faith, yea, even if ye can no more than desire to believe, let this desire work in you, even until ye believe in a manner that ye can give place for a portion of my words.
I believe that Alma’s intent with these words was to get the Zoramites to build upon their initial desire for progress. He knew that this would need to be their very first step toward developing their faith in the atonement. That same basic principle applies to so many other areas of our lives, both spiritual and temporal. Finding and building upon a desire to improve. Letting that desire work within us, and of course, acting and building a plan.
So my friends, what areas of improvement to you want to tackle?
Till next time. If you have any feedback, feel free to fill in the form.


